
 The most fun I ever had using Mathematics to solve an original problem ('original' meaning I had to work it out for myself without any help) was back while I was working as a junior engineer/floor sweeper at Bently Nevada Corp. To make measurements of rotor shaft position within a plain sleeve bearing, everyone up until that time would just "guesstimate" the limits of motion that indicated the bearing clearance. I decided there would soon be a better way.
With just a few measurements of rotor position in X and Y (as shown here), can you construct the most likely circle out of these points? It seems like it should be easy, but how can we be certain of getting the right result? And how do you teach a computer to do this without your visual help?

One solution would be to take every possible combination of three points, determine the circle's parameters, then make an average of all the possibilities. But there is a better way.
If there are 47, 102, 18 or any other number of data points we'll call N, then the raw data are an N-dimensional object that can only be perfectly represented using all N dimensions. But common sense tells us that most of those dimensions are unnecessary, because it really only takes 3 numbers to represent a circle: the value of its radius, and the X and Y coordinates of the circle's center. If all these data points were exactly on a perfect circle, they would not be N independent entities, because there would be a very concise rule dictating where the points were allowed to be. In reality, though, they won't all line up perfectly (see above), so we need a way of determining what is statistically the best circle described by the data.
Mathematically the problem is how to minimize the distance between every point and some proposed circle by adjusting the circle's position and radius. The optimization parameter used is the sum of the square of how far off the circle each data point is. Such an optimized circle will be known as the "least squares best-fit."
The question really boils down to this: how do you smoosh an N-dimensional object (a data set with N points) into just three pieces of information? And how can we be certain that they represent the optimum best fit? It's easy, if you know how to use a handy little thing called The Perfectly Normal Equations.
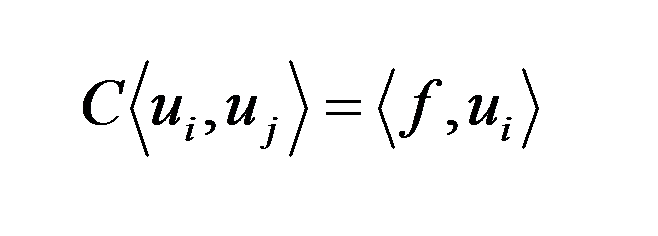 |
| Don't panic - this is a Perfectly Normal Equation. |
Many textbooks refer to these as simply the "Normal Equations," and this omission betrays the authors' ignorance regarding the real origin of the name, as well as their deplorable lack of familiarity with the works of Douglas Adams. They assume it's because "normal" is another word for "orthogonal" meaning "perpendicular to each other." In other words, no combination of any of the equations will adequately work as a replacement for any one of them.
While that is technically true, the real reason for the name "Perfectly Normal Equations" is so that when people see them, they will be prepared to accept these equations as "perfectly normal" and will not freak out and alert the Authorities, or do something equally dramatic and ill-advised.
The one slightly disconcerting thing about the Perfectly Normal Equations is that there appears to be only one of them. And, they are not actually equations, but more like the pattern or formula one uses to create the specific Perfectly Normal Equations for any given situation. The elegantly simple statement shown above is really a set of instructions for how to combine something called "Basis Functions" into Perfectly Normal Equations which will then perform all kinds of wonderful feats.
Actually, the only wonderful thing they do is cast mathematical shadows, the way a 3-dimensional object casts a 2-dimensional shadow on a wall. But in this example, it's an object with hundreds of dimensions, and we want to "flatten" it down to just three pieces of information: the radius and two center coordinates of a circle. But that is wonderful enough for me. I am easily amused.
 So. What are the Basis Functions of a circle? Whoops - they didn't teach us that in school, did they. That is the part I had to figure out all by myself, and this is the stroke of jeenyous that leads to this amazing solution to a tricky problem.
First, what does the word "circle" really mean? To get specific enough to be useful, we have to define it as those points on a plane that are all exactly a certain distance (called the radius) from one point (called the center). We can use good ol' Pythagoras' formula for the distance between points. And that is the rule or statement that defines what is a circle.
But not every circle is centered at point 0,0, and so we have to allow for the possibility that the center is located at some point (xo, yo) instead:
 |
| General Equation of a Circle |
Just because I felt like trying something different, I decided to re-organize this equation to make it look like a polynomial in X and Y being equal to a function of X and Y. The inelegant result is this:
 |
| The John S. Jacob form of the Circle Equation |
And now the AHA! moment. In that form, a circle looks exactly like something that might fit in the Perfectly Normal Equations:

If you've ever sweated through a math class, you might be experiencing some disappointment right here. "What? That's it? x, y and 1 are your basis functions? That's LAME!" Well, to be honest I expected something more complicated too. But that's how it comes out. Some days there's a fine line between genius and idiocy.
Now the Perfectly Normal Equations can be written out in all their salacious details. I will spare your bandwidth here, but if you really want to see them in their exposed glory, contact me and I'll send you a pdf.
Three basis functions means there are three Perfectly Normal Equations, each containing three terms. That forms a 3x3 grid, which itself makes a new kind of number that obeys a fancy sort of arithmetic called matrix algebra. All we need to do is find the inverse of that matrix to solve for the three unknown constants, C. Why? What will knowing the three C's give us?
Aha! Another flash of genius. The three C's are enough information to puzzle out the three exact values of xo, yo and r. And THAT tells us the absolute best circle that fits the entire data set.

Anyone can do this, because if you're reading this, you personally have access to about 1 million times the computing power needed to perform this calculation in less than a second. And the chances are very good that you have unknowingly already used Perfectly Normal Equations.
If you ever took a science, economics, business math or statistics class, you may have used Linear Regression to find a straight trend line that fits some data. Did you ever stop to wonder where they first got the formula for doing Linear Regression? No, of course you didn't. Because you, unlike me, are Perfectly Normal.
Linear Regression is nothing more than the Perfectly Normal Equations using x and 1 as basis functions and a comparatively infantile 2x2 matrix inversion.
That's how Perfectly Normal they are!
Not to brag, but I've used the Perfectly Normal Equations and a 10x10 matrix inversion to save my former employer mega $$$ and heaps of space on a circuit board. Talk about tough, I used up a whole pad of paper and an entire pencil working it all out.
But they were really nice about it - they bought me another one.
Exactly where did I learn all this stuff? Oh, books, mostly. This one by Kincaid and Cheney is a really good one:

I have several routines for Chi-square minimization, depending upon the characteristics of the independent variables, range of dependent variables and so forth. Wrote most of them in Fortran, but later converted them to MathCad. Linear regression is a special class of these techniques.
ReplyDeleteSure, most calculators today have half a dozen or more built in routines for fitting data to various curves. The Perfectly Normal equations minimize the square of whatever statistic you select, be it the Chi statistic or an ordinary error function. They were represented to me, anyway, as the most general or universal form of Least Squares Approximation. One of the best things I ever learned in a math class.
Delete